Zoom in on Stablecoins


This year was an eventful year in the world of crypto. In particular, the collapsed Terra and FTX crisis affected the entire crypto market, and again attracted the attention of regulators to crypto and stablecoins. Stablecoins are valued for their technological features, while, at the same time, maintaining a stable peg to some financial asset or fiat currency (most often 1 US dollar). We decided to check how stable the six most popular stablecoins were during the year, namely from November 1, 2021 to October 31, 2022. The data used is openly available on CoinMarketCap.
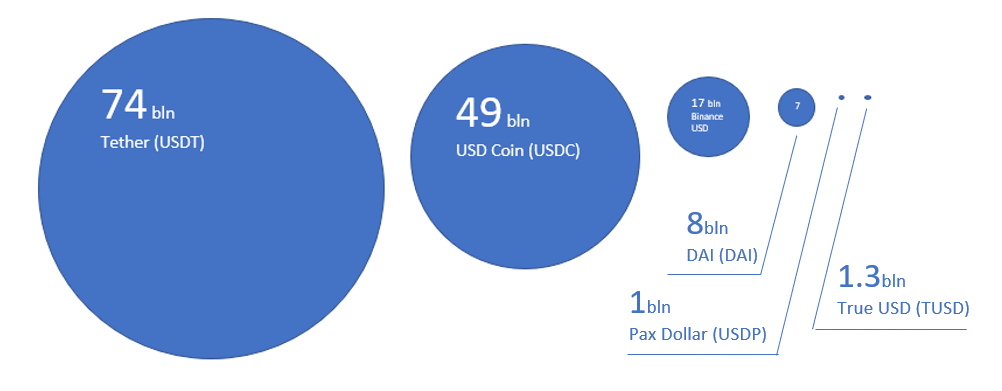
We have selected six major stablecoins by market cap as of the end of October, namely:
We have assessed the following parameters of these stablecoins past performance:
Volatility - even though stablecoins are pegged to their reserve asset, there are slight deviations that are considered acceptable. We have quantified and visualized those.
Extreme cases - some events cause stablecoins to deviate from the peg by bigger margins than usual.
Wins and Runs - defined as days when significant trading or external event led to an increase or decrease in capitalization of the coin.
It's important to mention first that even the top six stablecoins are quite different in their sizes and the assessment is done for assets in different weight categories.
Moreover, the sales volumes relative to the market caps, a measure of velocity, are also different for the selected coins:
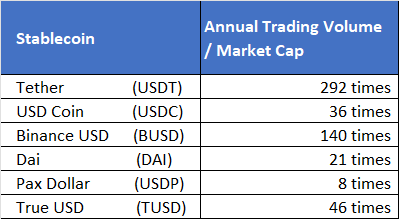
As we can see, Tether is an absolute leader in this chart, showing its utility superiority, followed by Binance USD, which benefits from its issuer's dominant position in the market for crypto exchanges.
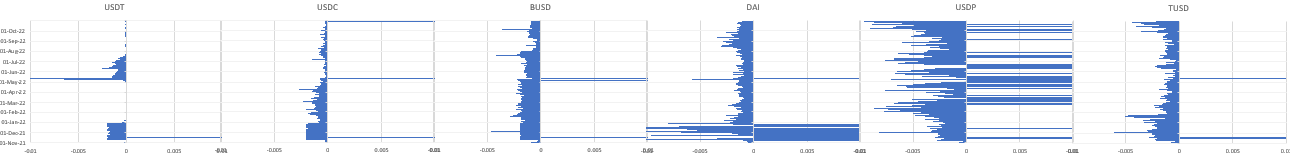
Volatility
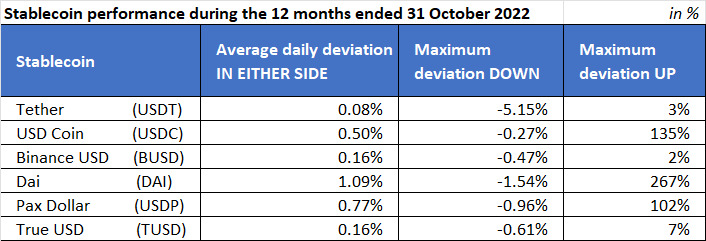
Average deviation, calculated as the average of the daily maximums in either side, was lowest with Tether and highest in DAI. However, Tether had an extreme low on Luna/Terra collapse day on May 20, 2022.
Extreme cases
We have defined this parameter as days when the coin price deviated more than 0.5% from its peg, on either side. Since all coins in our sample are pegged to one USD, it basically means the number of days when these coins were priced lower than $0.995 or higher than $1.005)
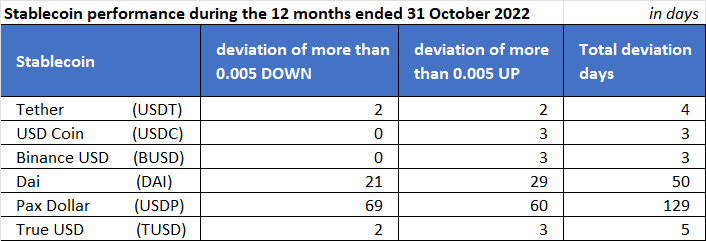
As we can see from the chart above, custodian stable coins have very few extremes, while algorithmic DAI and Pax Dollar allow for that.
Overall, throughout the year the coins looked as follows:
Wins and Runs, we defined them as days when the trading was larger than normal daily volumes, by more than 100% (2 times), that led to an increase or decrease in capitalization of the coin. We also looked at significant drops or increases in market cap following some unfavourable events, Luna/Terra collapse, for instance.
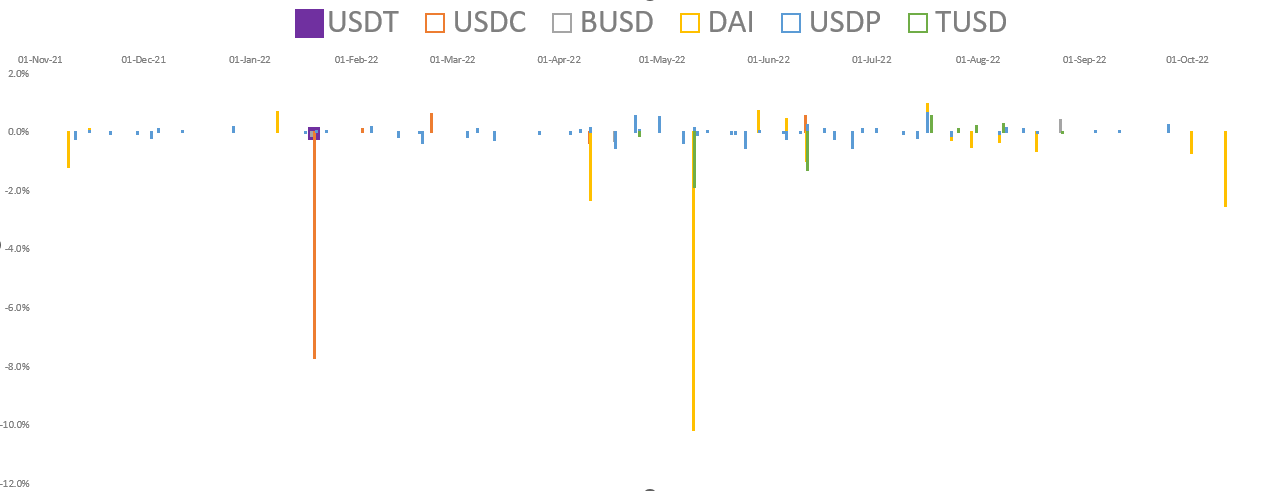
Day wins matching our criteria were minimal: coins did not get more than 1% of their market cap during such days. However, USD coin won around 8% ($4 billion) of their market cap during the two weeks following Luna/Terra Collapse.
Tether (USDT) had only one activity matching our run criteria, on January 20, 2022 it lost less than 0.1% of its market cap, or about $56M. We were not able to find what happened then but on that exact day, USD Coin (USDC) lost almost 8% of its market cap at the time or $4 billion. DAI evidenced 10% of market cap loss in just one day during the Luna/Terra collapse.
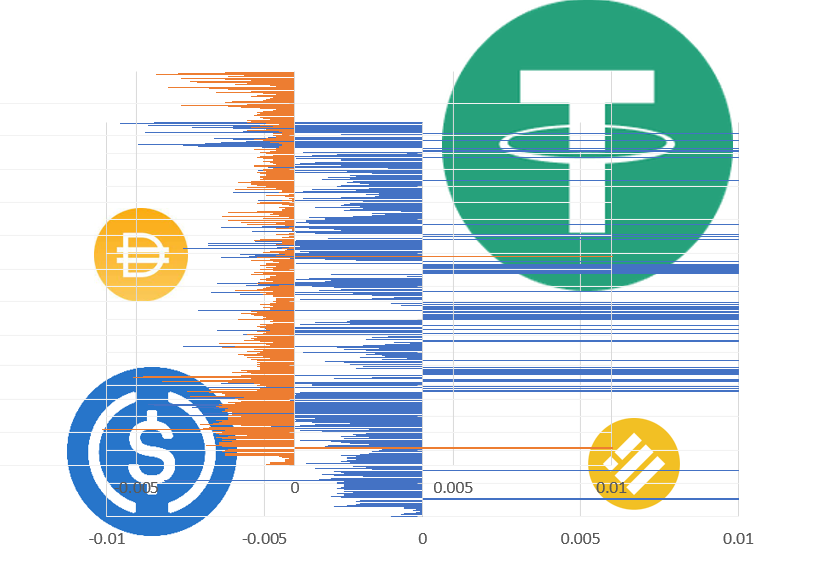
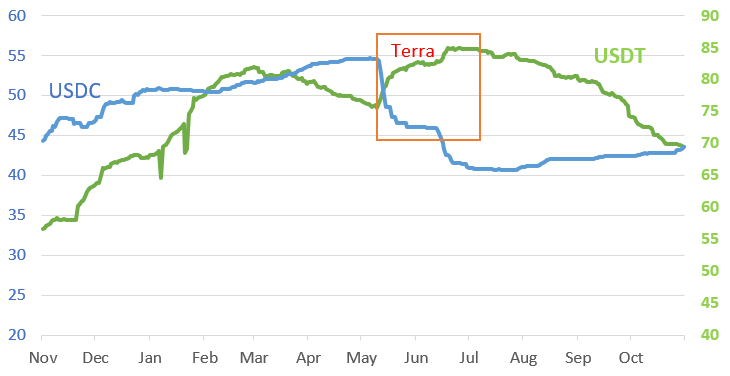
In the two weeks following Luna/Terra collapse, Tether had lost around 10% ($8.5 billion) of its market cap. It is interesting to notice that the volume changes for Tether (green on the chart below) and USD Coin (blue on the chart below) were moving inversely during Luna/Terra collapse.
Today, amid FTX crisis, we also observe stablecoins. Read our review on how stablecoins react to FTX/Alameda crisis next. Looks like we will be observing the above measures regularly.