FTX Made the Crypto Winter Even Colder. Technical Analysis Overview
The FTX crisis fuelled the current downtrend on the charts of the most liquid cryptocurrencies.


The FTX crisis fuelled the current downtrend on the charts of the most liquid cryptocurrencies.
“FTX is currently unable to process withdrawals. We strongly advise against depositing”, — recently a banner on the official website of one of the most important crypto exchanges in the world posted this statement. As of November 20, the site is unavailable.
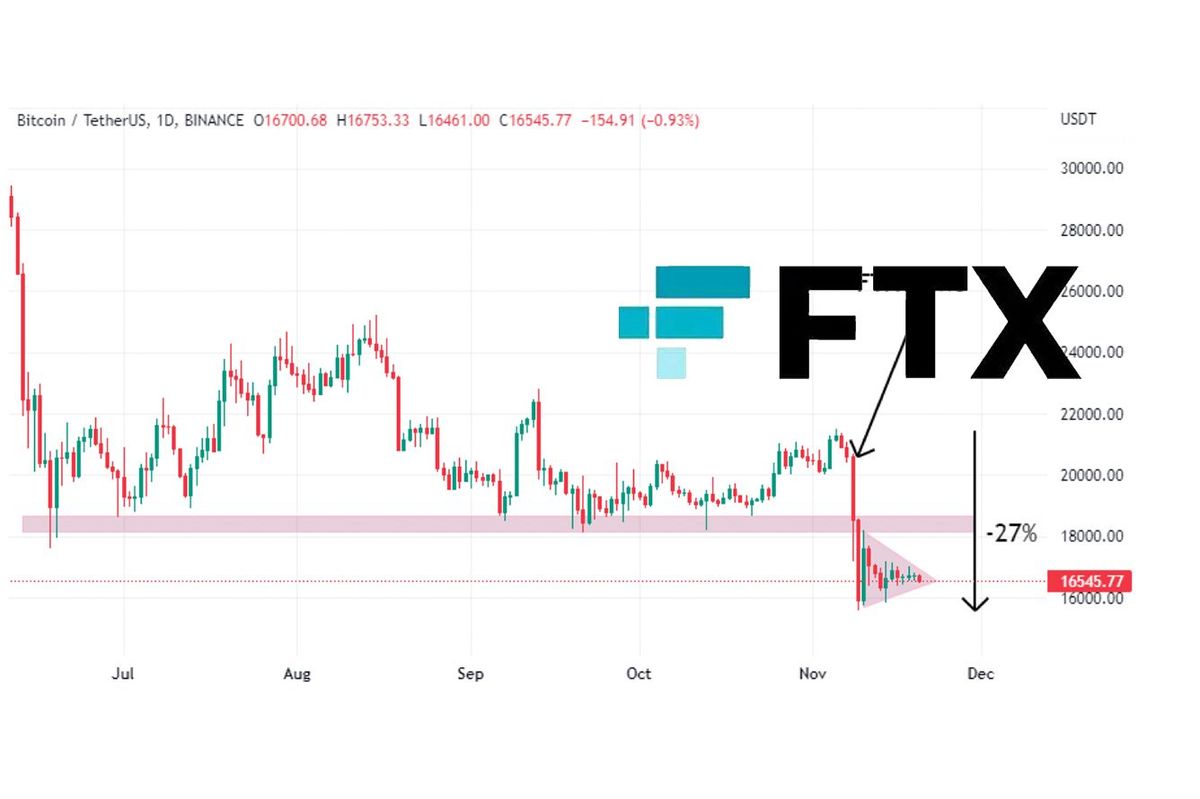
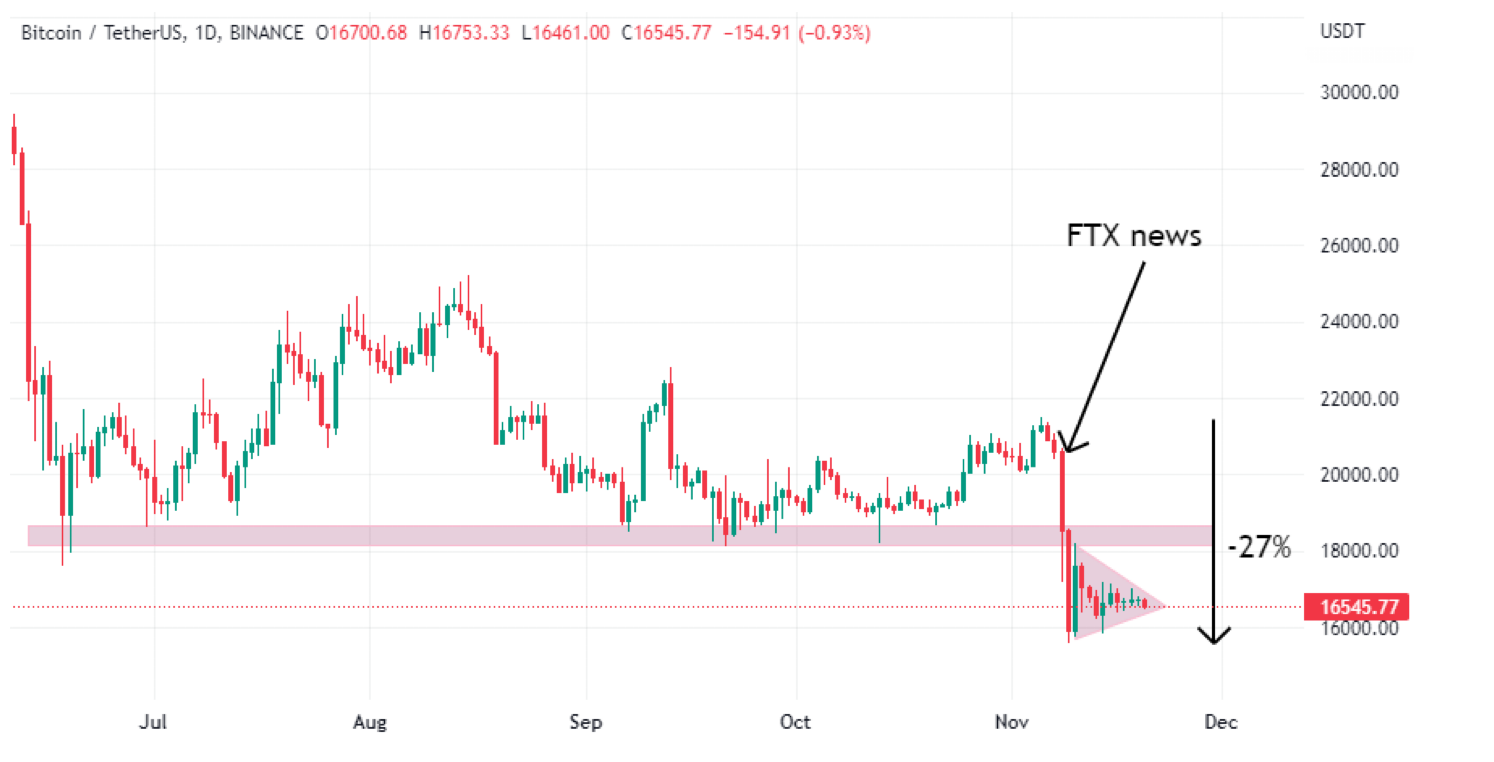
The dramatic fall of the crypto-giant fuelled the current downtrend on the charts of the most liquid cryptocurrencies. The main impulse for the downward movement occurred on November 8.
The BTC/USDT exchange rate on Binance exchange has broken through the support area that has been forming since June, having overcome many local lows. The breakdown was impulsive. The fall from a local high on November 5 to a new local low on November 9 was about 27%. The attempts to pull back above 18,000 USDT were unsuccessful - the support area has now become a resistance area. A further rapid drop in volatility and a symmetrical triangle pattern formed on the chart clearly indicating the total uncertainty on the market: both buyers and sellers froze in anticipation of new signs.
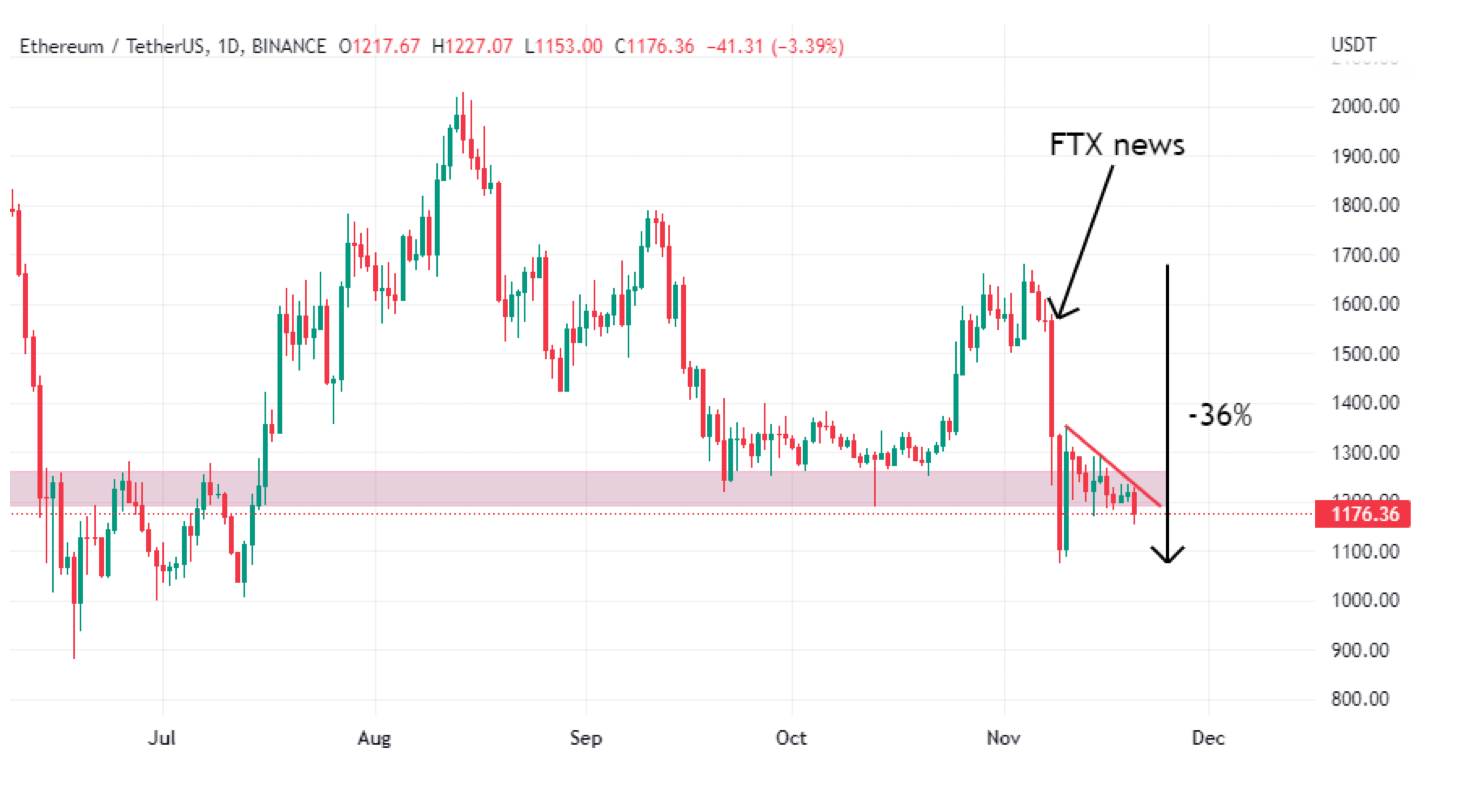
Ethereum has suffered even more from the above-mentioned events, losing more than a third of its price from the November 4 local high to the November 9 local low. The breakout of the support area looks more blurred compared to the movements of Bitcoin, but the price of Ethereum is now also fixed below this area around 1,200 USDT. The downtrend prevails, but it is too early to tell whether the price will move up or down out of this range.
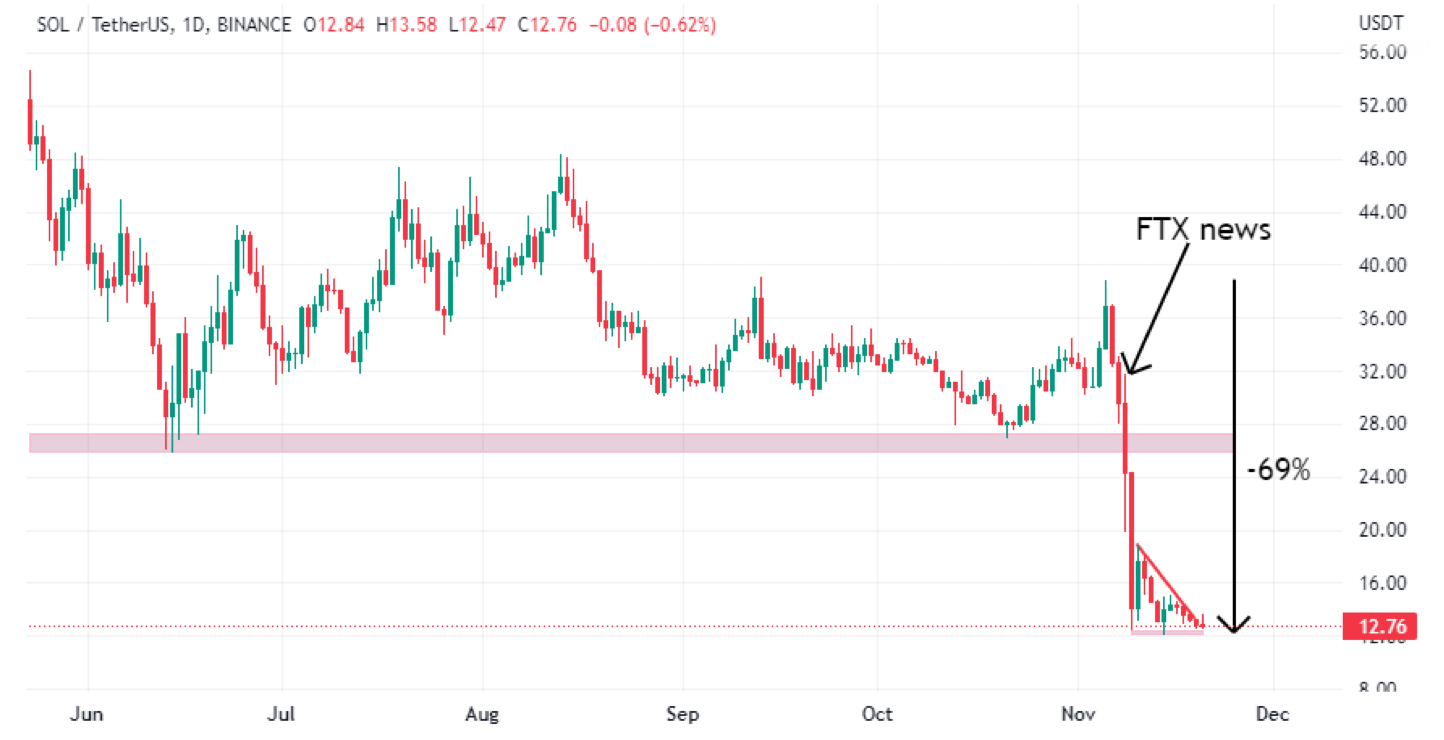
Special attention should be paid to another liquid coin, Solana, which FTX has actively invested in. The crisis of the second largest crypto exchange in the world hit the coin really hard. From the local maximum on November 5 to the minimum on November 9, the price of the coin fell by more than two-thirds. On November 14, the minimum was updated, but slightly. On November 20, Solana was around 12.50. Price bounces up face pressure from sellers. The probability of the breakdown of the next support level is high, especially if there is no positive news in the media.
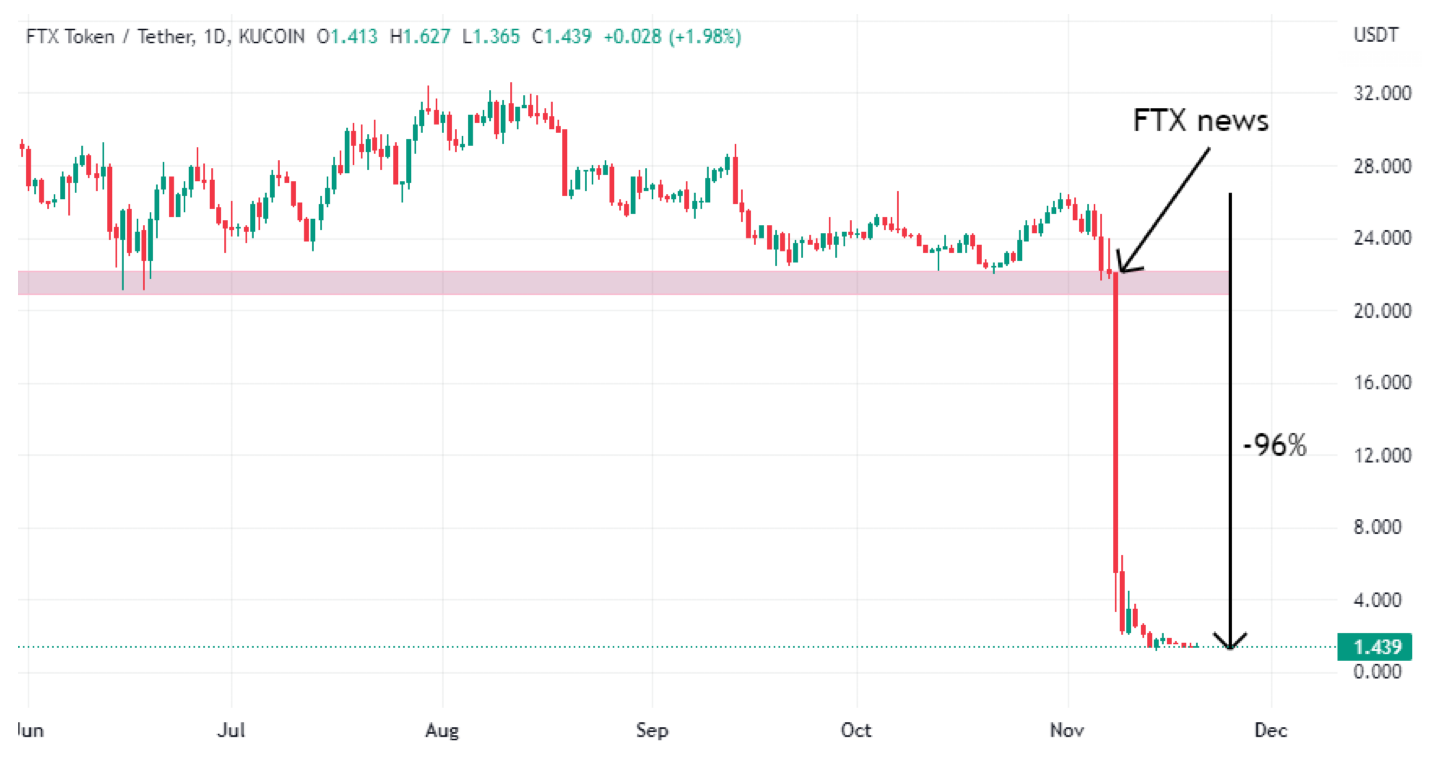
Clearly, the situation is disastrous for FTT, the native token of the FTX exchange. The fall in price from the local high on October 31 to the low on November 14 was about 96%. Furthermore, the fate of the token completely depends on how the exchange, which is now undergoing bankruptcy proceedings, solves its problems. While some investors are buying at the bottom and waiting for substantial growth, others are fleeing the sinking ship, pushing the price further along a downward trend.
Many compare the current situation to the fall of Luna and UST, which was in the top 10 by market capitalization back in May. At the moment bitcoin has lost about a third of its price, and there has been no recovery up till now.
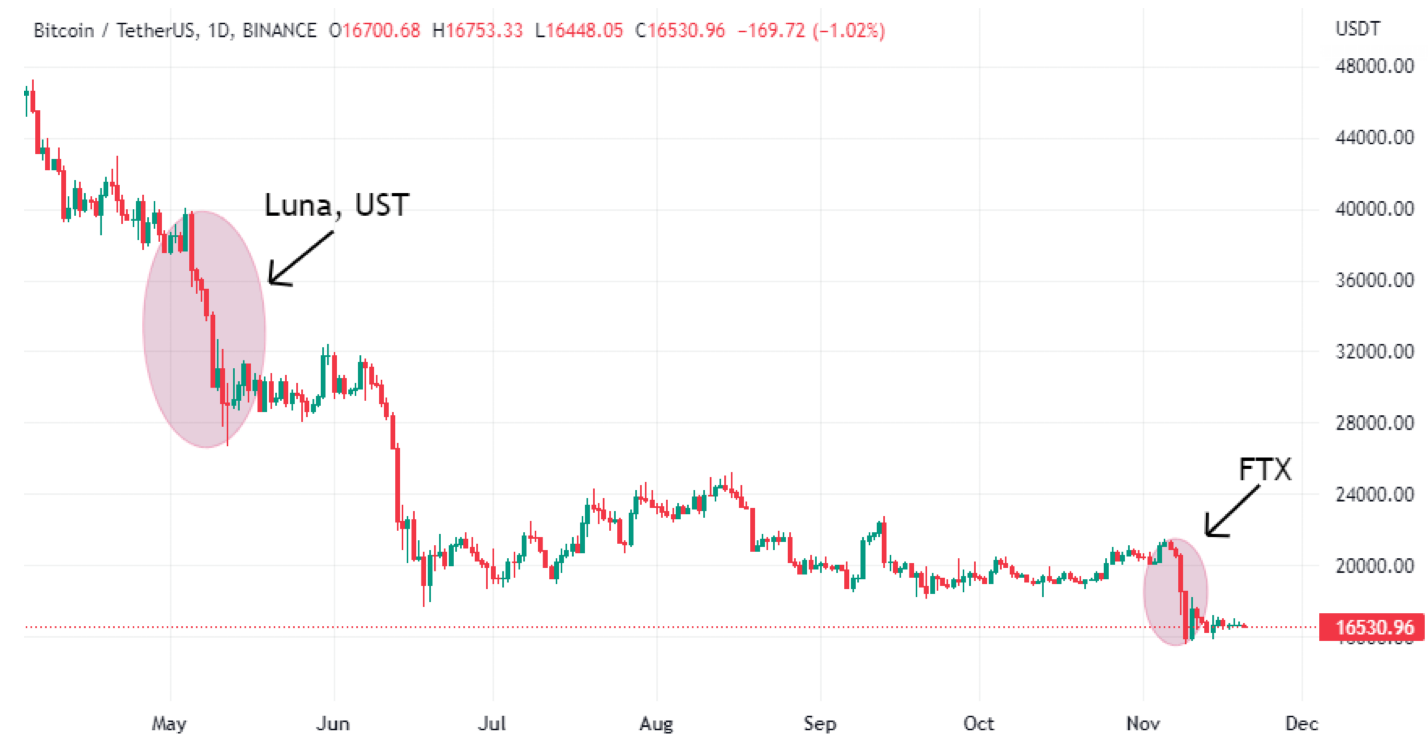
Both these events are similar at least in one way: they have aggravated the crisis of confidence in cryptocurrency as an investment instrument and means of payment.