MVRV. A Signal to Buy Bitcoin Now?
MVRV, a ratio that compares the market capitalization of an asset to its realized capitalization, indicates the beginning of the accumulation phase.


MVRV, a ratio that compares the market capitalization of an asset to its realized capitalization, indicates the beginning of the accumulation phase.
Many people dream they would have bought bitcoin for $5 and sold it for $60,000, making a huge fortune. Still, now, when its price is at least 1/3 the ATH, no one rushes to crypto exchanges and rather waits for the "bottom". Is the bottom reached and is it worth buying now? Maybe. The MVRV indicator might suggest a new growth cycle. Not financial advice!
MVRV - Market Value to Realized Value - is calculated as the ratio of market capitalization (value) to realized capitalization (value).

Market capitalization is not a new measure, it is widely used in investment theory. The market capitalization of a company is given by the formula MC=N x P, where N is the number of company shares outstanding, and P is the market price per common share. This is not a company valuation tool, since it does not account for the company debt (leverage) and is rather used for assessing the relative size of companies.
Unlike Market Capitalization, Realized Capitalization is a relatively new concept and was introduced specifically in relation to cryptocurrencies. In 2018 Nic Carter, the founder of Coinmetrics.io, argued that multiplying all mined bitcoins by the current price is inferior for a simple reason: there are coins that are permanently lost and removed from circulation. So to weigh out these coins, he proposed instead of the current price, to use the price of the coin at the moment of its last movement. For example, if the last transaction of 10 bitcoins was at a price of $100, then their Realized Capitalization would be $1,000 even if the Bitcoin price is higher now.

Upon initial review, Realized Capitalization strips out long-term holders "hodlers" of the coins together with lost ones. However, this "bug" was considered a feature so Realized Capitalization became a measure that reflects more long-term investors' view on the asset rather than its current trends.
Further, MVRV, the ratio of the two capitalization measures shows interesting patterns that coincide with crypto bear and bull markets. Higher MVRV values indicate a larger degree of "unrealized" profit in the system, happening at late stage bull cycles, periods when investors distribute coins to lock in gains. Lower MVRV values indicate a smaller degree of "unrealized" profit in the system, signalling poor demand dynamics. For investors, this is the accumulation phase.
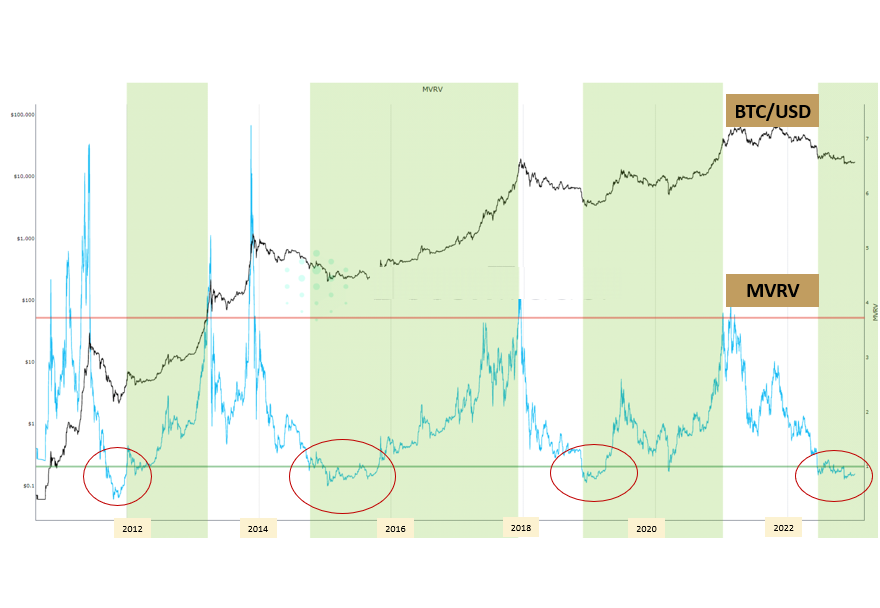
The authors of the indicator, Murad Mahmudov and David Puell, identified also two key levels of the indicator: below 1 - the asset is undervalued and above 3.7 - the asset is overvalued. Now, at the beginning of 2023, the MVRV values for Bitcoin fluctuate below 1.
Let's check how the indicator showed its effectiveness on historical data and whether it was profitable to buy bitcoin at MVRV values below 1 and sell at values above 3.7 within 10 years.
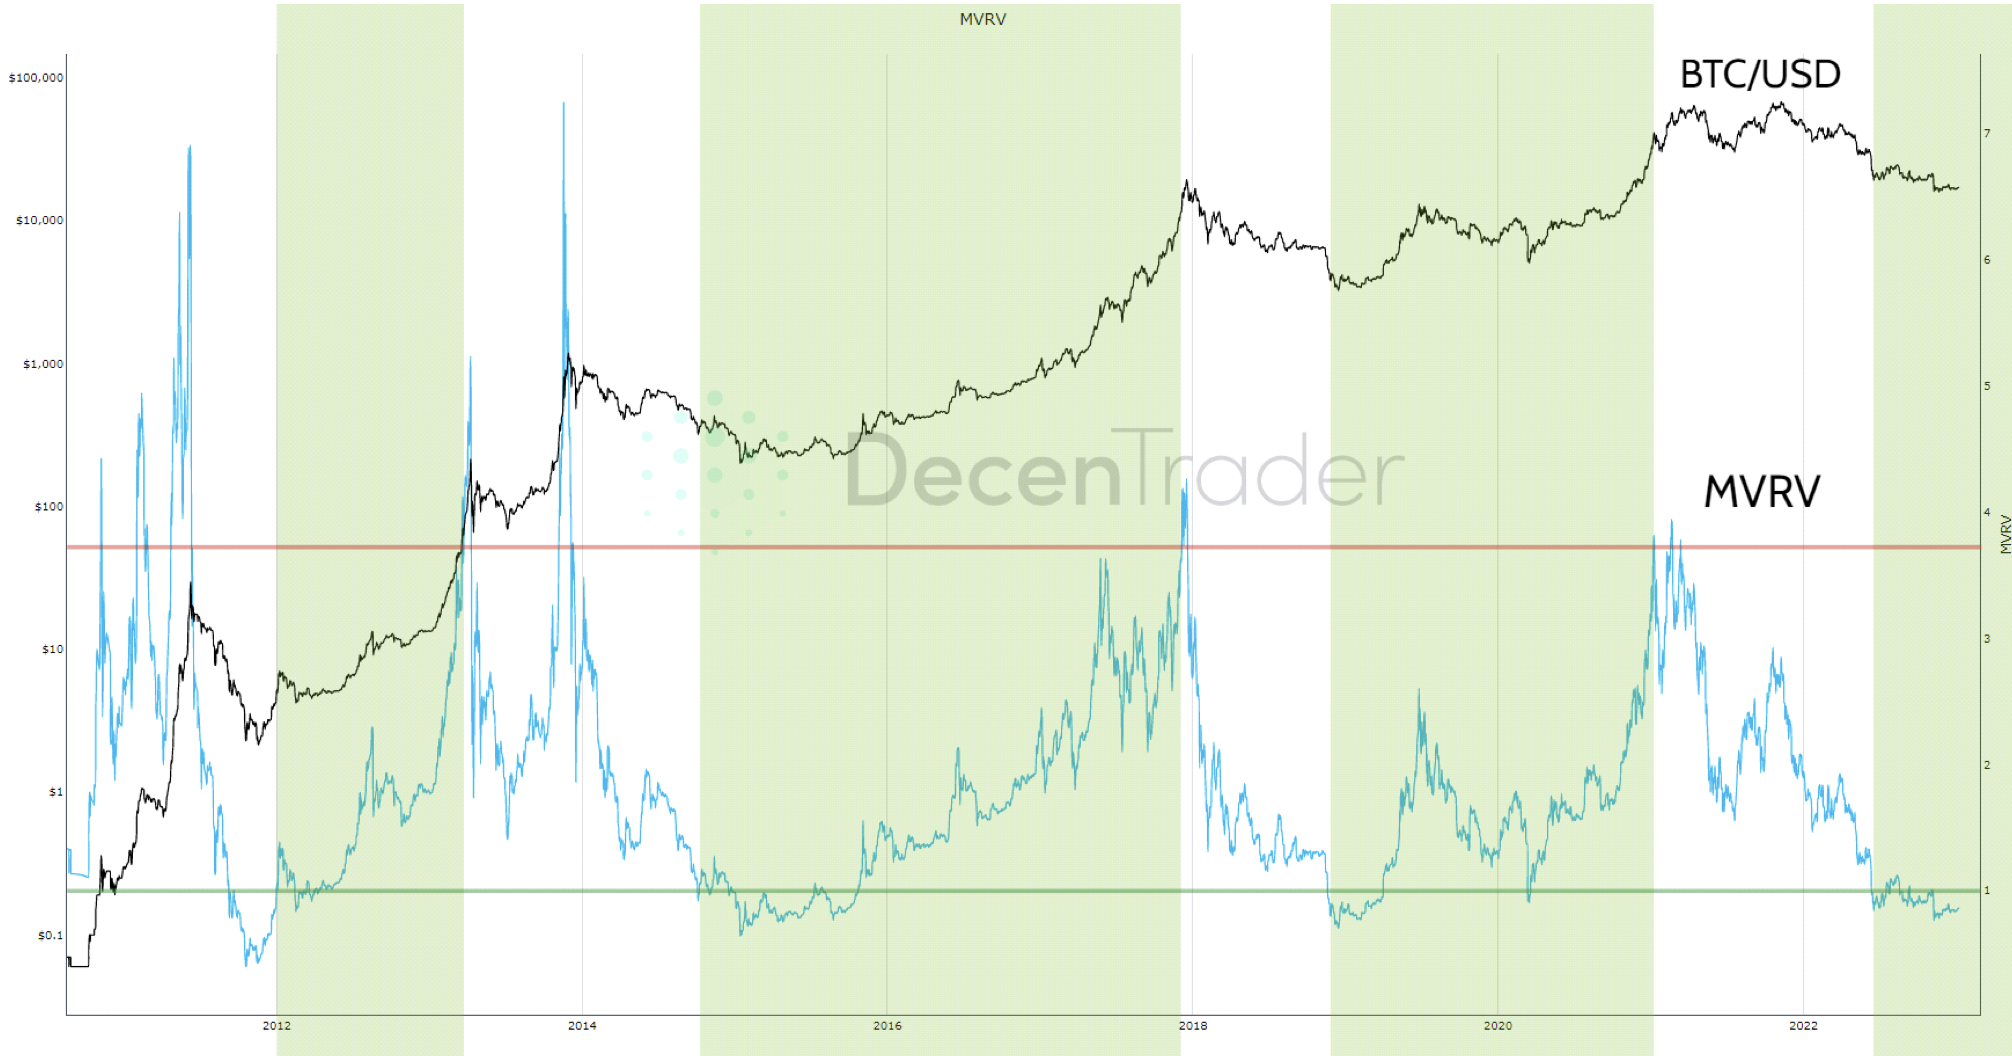
On the chart, the green colour indicates when it is worth holding bitcoin. For the BTC/USD rate, a logarithmic scale is used, for MVRV values - a linear one. Since January 1, 2012, only 4 transactions could have been made using this strategy, one of which would not have been closed until now. If you invest $1000 in trading, then with the reinvestment of profits at the time of the last closed transaction (January 7, 2021), the account would increase to $4.75 million. Taking into account the currently open transaction, the balance would be $3.59 million as of January 8, 2023.
A simple purchase of bitcoin at the beginning of 2012 for the amount of $1,000 by January 8, 2023 would have given $3.23 million. This is less than the result of trading on the indicator, but on the other hand, at the maximum, a simple purchase of bitcoin would have given $12.76 million (November 8, 2021). Obviously, no one is able to perfectly guess the price reversal point and sell at the maximum.
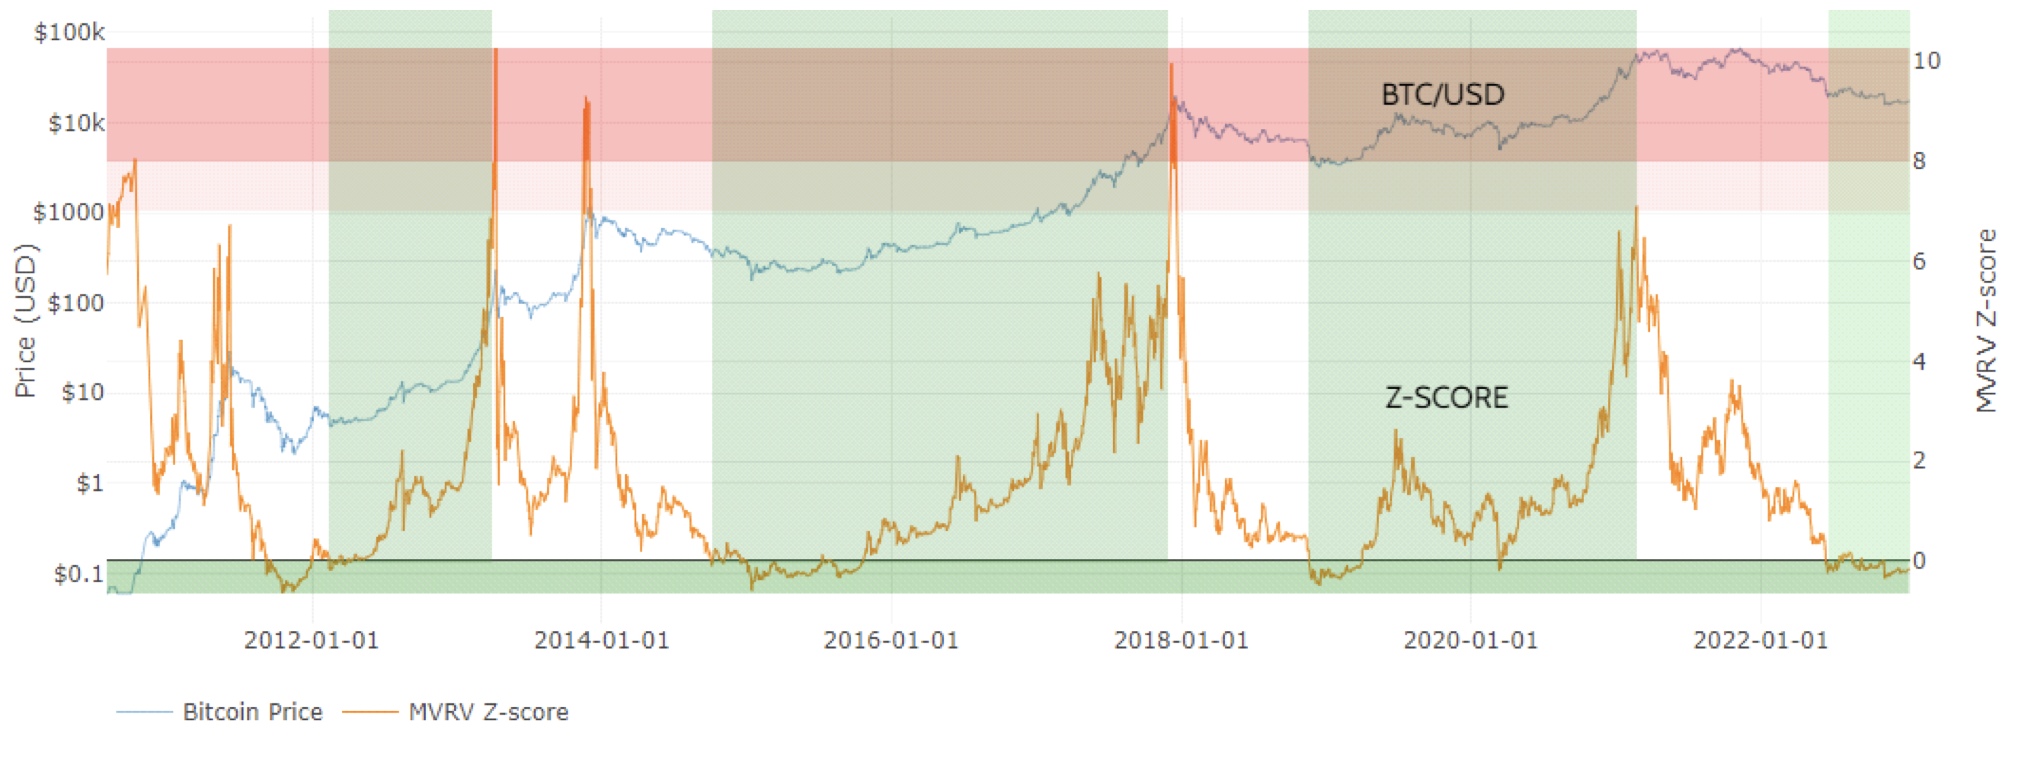
More interesting results can be obtained by applying a modified version of the original indicator - MVRV Z-Score. It is calculated as the difference between market capitalization and realized capitalization divided by the standard deviation of market capitalization. The indicator properly reflects sharp changes in market capitalization, given the volatility. The indicator trading strategy involves buying below level 0 and selling above level 7.
To sum up, MVRV ratio and its derivatives give decent indications of distribution and accumulation phases. This theory might be the force behind the current bullish trend in Bitcoin and other cryptocurrency markets, coupled with macroeconomic expectations. Or, it could be because we haven't observed any major crypto project collapse for already one month (TIC:)